Environmental monitoring is necessary because natural processes and human activities can change chemical concentrations in air, water and soil. Systematic, repeated measurements at suitable locations establish baselines and reveal trends, allowing harmful changes to be detected and risks to ecosystems or human health to be assessed. The evidence supports regulation, source investigation and remediation, and shows whether management strategies are effective.
Exam tomorrow? Do these seven things, in this order.
“Pollution is harmful, so the environment should be monitored” is an opinion, not analysis. Here is what the verb actually demands.
Analyse means identify the relevant components and explain their relationships. Connect a pressure or source to readings, chemical change, consequences and an evidence-based decision.
A strong answer names what may enter or change in the environment, what should be measured, how the chemistry produces an effect, why repeated and comparative evidence is required, and what the evidence allows people to decide.
Monitoring is not prevention or clean-up. It supplies the evidence used to choose, target and evaluate those actions.
The central judgement: reliable decisions require measurements that are chemically relevant, representative, and interpreted with appropriate caution.
2 · One answer framework: TRACE
Use the same five jobs in every context — water, air, soil, or a compound you have never seen before. This is the only framework on this page; there is nothing else to memorise.
TTrigger
RReadings
AAnalysis
CConsequence
EEvidence → action
TTrigger — identify the natural process or human activity that creates a pressure, such as fertiliser runoff, combustion emissions or mine waste.
RReadings — name useful indicators, sample medium, locations and times. Include a baseline or control, repeated sampling and the analytical method when relevant.
AAnalysis — explain the chemical or environmental mechanism linking the trigger to the measured change. This is where equations and causal language matter.
CConsequence — state the ecological, health or material effect and qualify it by concentration, chemical form, exposure pathway and duration where appropriate.
EEvidence to action — interpret the pattern, acknowledge a limitation, compare with the applicable baseline or guideline, recommend action and explain how re-monitoring tests whether it worked.
TRACE is a planning tool, not a set of labels to paste into an exam paragraph. Never write “T — …, R — …” in a booklet. Plan with the letters, then write fluent prose. Where the verb or stem calls for a position — assess, evaluate, justify, or a discuss question that asks for a conclusion — make it explicit and support it. Stating it early and returning to it is a useful writing strategy, not a requirement; developing it into the conclusion is equally valid. Do not add one where the stem never asked.
How TRACE relates to everything else on this page
You will meet several organising ideas here. They are not competing frameworks — they do different jobs.
Idea
What it is for
TRACE
Your private planning checklist in the exam. Five jobs to cover before you start writing.
The monitoring cycle (below)
How real environmental management actually operates. Useful for explaining why re-monitoring matters.
Observation → inference → limitation → decision
The evidence-language test you apply inside the A and E steps of TRACE.
Judgement or position
Required for assess and evaluate, and wherever the stem asks — justify needs a supported position, and some discuss questions do by their wording. Not automatic for analyse. It may be stated early for clarity or developed into the conclusion, provided it is explicit and supported. It is not a sixth TRACE letter.
How much of TRACE a “need / design” question demands
This is a guide for the broad analyse the need and design a monitoring program questions. It is not a quota. A data, calculation or “distinguish” question follows the demands of its own stem — Q2, Q4, Q5 and Q6 in section 13 all earn full marks without using every letter.
Marks
What the response has to achieve
TRACE jobs usually involved
2
Two distinct linked points that answer the verb
usually R and E
3–4
A named context plus at least one causal or evidential link
select from T, R, A, C as the stem requires
5–6
Evidence design, mechanism and consequence, a qualified limitation and an action — plus a supported judgement only if the verb or stem asks for one — stated early or developed into the conclusion
most of TRACE, with the limitation sitting inside E
7–8
Representative and quality-controlled design, justified breadth, limitations and re-monitoring — sustained throughout, and carrying a judgement through the response where the verb demands one
all of TRACE, developed across more than one context or stage
The test is always the stem, not the framework. Delete any sentence that does not earn a mark the question actually demands.
Build your answer — TRACE as five replaceable sentences
TRACE is not five topics to write about. It is five sentence jobs. The grammar of each one stays the same in every question; only the chemistry inside the brackets changes. Learn the five patterns and you can build an answer for a context you have never seen.
The rule that governs all of this: the verb and the stimulus tell you which blocks you need. The marks tell you how far to develop them. See section 11. TRACE blocks do not map one-to-one to marks. The 4-mark example below uses five block functions inside four marks; a 2-mark answer may use half of one block.
Block
Sentence pattern
Use it when…
Delete it when…
T Trigger
[named source or activity] may introduce or change [named chemical or property].
The stem names a source, site or activity.
The question is purely about method, definitions or data already given.
R Readings
Measure [indicators] at [comparison sites] across [times or conditions].
Almost always — this is the monitoring content itself.
The stem only asks you to interpret data you were handed.
A Analysis
[chemical mechanism] causes, or is consistent with, [measured change].
The stem asks how or why, asks for causal interpretation, or the chemistry is what makes the reading meaningful.
The point can be answered fully without a mechanism. (Often outline, distinguish or calculate — but check the stem, not the verb name: an outline can still ask for the features of a mechanism.)
C Consequence
This may lead to [qualified consequence].
The question asks why the change matters.
The question is about evidence quality or method choice only.
E Evidence → action
However [limitation]; therefore [action and re-monitoring].
The stem asks why the evidence matters, or asks for a decision, limitation, action or evaluation.
Omit it entirely when the stem asks only for a calculation, a definition, a classification, or an observation from supplied data. At 2 marks it often shrinks to the “therefore” half only.
The same five blocks, filled three ways
Only the bracketed chemistry changes. The sentence grammar does not.
Eutrophication
Acid deposition
Named metal
T
Agricultural runoff may increase nitrate and phosphate.
Combustion may release sulfur dioxide and nitrogen oxides.
Waste from a former mine may release lead.
R
Measure nitrate, phosphate and dissolved oxygen upstream and downstream, across seasons and flows.
Measure SO₂ and NOₓ upwind and downwind, with rainfall pH and sulfate, recording wind and weather.
Measure lead in water and sediment at background and downstream sites, stating the filtered or unfiltered fraction.
A
Decomposition of the extra biomass raises microbial oxygen demand.
Atmospheric oxidation forms sulfuric and nitric acids, deposited wet and dry.
Lower pH can increase dissolved metal; particles settle and are stored in sediment.
C
Dissolved oxygen may fall and stress aquatic organisms.
Soil and water pH may fall where buffering is poor, damaging organisms and stone.
Organisms may be exposed over long periods, depending on concentration and form.
E
However one comparison cannot prove the source; therefore repeat and evaluate nutrient controls.
However meteorology and long-range transport limit attribution; therefore pair emissions with deposition and re-test after controls.
However total concentration is not bioavailability; therefore repeat after remediation using the same method.
Three real stems — watch the verb change the structure and the marks change the depth
These are three different questions on one context. Read each stem first: the verb decides which blocks appear at all, and the mark value decides how far each one is developed. Clauses that carry over are highlighted so you can see what is reused and what is genuinely new.
2 marks · Outline
“Outline why nutrients and dissolved oxygen should be monitored in a river.”
Nitrate and phosphate indicate nutrient enrichment entering the river, while dissolved oxygen indicates whether that enrichment is associated with oxygen stress. Monitoring both therefore links a possible chemical pressure to its ecological effect.
Blocks used: R, and the “therefore” half of E. The stem asks why both are monitored, so the answer must separate the pressure indicator from the response indicator. Outline asks for main features, so a full mechanism, a named source and a judgement are not required by this stem and are unlikely to be the best use of limited time.
4 marks · Explain
“Explain why both nutrients and dissolved oxygen should be monitored downstream of farmland.”
Agricultural runoff may increase nitrate and phosphate in the river. Nitrate and phosphate indicate nutrient enrichment, while dissolved oxygen indicates whether that enrichment is associated with oxygen stress. Downstream of farmland these should be measured against an upstream reference. Nutrient enrichment can raise algal biomass, and decomposition of that biomass increases microbial oxygen demand, so dissolved oxygen may fall and stress aquatic organisms. Repeated comparable results allow enrichment to be detected and nutrient controls to be evaluated.
Added: T, A, C.Explain demands a causal chain, so the mechanism now has to be there. This is a generous, high-quality exemplar at 4 marks, not the minimum length — a tighter answer covering the same functions can also earn full marks. It still demands no judgement — adding one is not required by this stem and is unlikely to be the best use of limited time.
6 marks · Analyse
“Analyse the need to monitor nutrients and dissolved oxygen in a river affected by agricultural runoff.”
Agricultural runoff may increase nitrate and phosphate in the river. Nitrate and phosphate indicate nutrient enrichment, while dissolved oxygen indicates whether that enrichment is associated with oxygen stress. Both should be measured at an upstream reference site, beside the suspected input and downstream, repeated across seasons and flow conditions. Nutrient enrichment can raise algal biomass, and decomposition of that biomass increases microbial oxygen demand, so dissolved oxygen may fall and stress aquatic organisms. A downstream pattern of higher nitrate and lower oxygen is consistent with this mechanism but does not by itself prove the farm is the source, because flow, temperature and other inputs have not been excluded. Repeated comparable results allow enrichment to be detected and nutrient controls to be evaluated, and continued monitoring tests whether conditions recover.
Added: indicator roles and repetition inside R, plus the limitation half of E.Analyse wants the relationships and their significance made explicit. In this stem the limitation strengthens the analysis, because it shows why the observed relationship is not yet sufficient without further monitoring — but a limitation is not something analyse universally requires. Note there is still no formal judgement: analyse did not ask for one. Assess and evaluate define the task as judging, so they always require one; justify requires a supported position, and discuss requires whatever conclusion its wording specifies.
What is actually changing across these three. Three things move at once, and it is worth separating them: the verb changes which sentence functions are required, the stimulus changes what chemistry is available to name (only the later stems mention farmland), and the marks scale how far each function is developed. The two highlighted clauses are reused throughout, though the 6-mark version extends them grammatically rather than repeating them word for word.
Then cut. Read your answer back and delete any sentence that does not earn a mark the question actually demanded. A 6-mark explain does not need a judgement. A distinguish question does not need a mechanism.
Swipe the diagram sideways →
Monitoring is a cycle, not a one-off test. Evidence leads to a decision, then further evidence evaluates the result. Step 7 is easy to omit — and it is where the marks for “evaluate management” live.
3 · What reliable environmental monitoring means
Environmental monitoring is the systematic and repeated collection and analysis of data used to characterise environmental conditions and detect change.
Systematic means measurements follow a planned and documented method. Repeated means they are collected often enough to distinguish persistent change from an anomaly. Comparative means results are interpreted against another place, time, baseline or relevant guideline rather than in isolation.
Core idea Baseline
The normal or reference condition used for comparison. It may come from measurements taken before an activity began, a suitable reference site, or a historical record.
Core idea Trend
A consistent pattern across repeated measurements. One reading is a point; a trend needs several comparable readings.
Core idea Threshold or guideline
A comparison value that helps decide whether further investigation or action may be required. It is not automatically a universal legal limit.
Core idea Indicator
A measurable property giving evidence about an environmental pressure or response — nitrate, dissolved oxygen, pH, SO₂, a named metal.
A chemical is not a pollutant merely because it is present. Nitrate, phosphate, calcium, magnesium and many metals occur naturally and may be beneficial or essential at suitable concentrations. Risk depends on identity, concentration, chemical form, location, exposure route and duration.
Why monitoring is needed
To establish normal conditions, detect change early, identify spatial and temporal patterns (that is, patterns across places and over time), assess risk, investigate possible sources, support regulation or remediation, and determine whether management actually worked.
One sample is an observation, not a source
A single sample can establish an observation, but usually cannot establish a trend or prove a source.
Category
Example
What it does
Observation
“Downstream nitrate was higher than upstream nitrate on one day.”
Reports measured fact with site and time. No cause inserted.
Inference
“A source between the sites may be adding nitrate.”
Interprets the pattern using qualified language.
Decision
“Repeat sampling and investigate likely inputs.”
Proportionate action that addresses the unresolved question.
Overclaim: “The nearby farm has been proven responsible.”
Defensible: “The pattern is consistent with a nutrient input between the sites; repeated comparable sampling is required before a source is identified.”
What a stronger design looks like
Upstream or background sites, plus sites beside and downstream or downwind of suspected sources.
Repeated sampling across days and seasons, with replicate samples.
Consistent collection and analysis every time.
Indicators of both pressure (what may be entering) and environmental response (what is changing).
Confounding matters. Rainfall, river flow, temperature, wind, season and soil properties may all explain part of a pattern. Representative sampling asks whether the selected times, locations, depths and sample types actually describe the environment about which the conclusion is being made.
Quality assurance protects the evidence. Calibrated instruments, known standards, blanks, replicate samples, clean containers, suitable preservation and documented chain of custody help separate a real signal from contamination, instrument drift or random variation.
Swipe the map sideways →
Site A gives the background comparison; without it, nothing downstream can be interpreted. Even this design supports a source — it does not prove one without repeated sampling across different flow and weather conditions.
4 · Water, air and soil: one connected system
Monitoring must match the medium, the movement of the chemicals, and the decision being made. Because the compartments are connected, a complete investigation may sample more than one.
💧 Water
Measure nitrate, phosphate, dissolved oxygen, pH, turbidity, conductivity, temperature and selected metals.
Compare: upstream with downstream, surface with depth, dry weather with runoff events, or current results with a baseline.
🌬️ Air
Measure sulfur dioxide, nitrogen dioxide, carbon monoxide, ground-level ozone and particles such as PM2.5 or PM10.
Compare: place monitors upwind and downwind, record wind and weather, and collect a time series — short peaks and long-term exposure answer different questions.
🌱 Soil and sediment
Measure pH, salinity, nutrients and named contaminants such as lead, cadmium, copper, arsenic or mercury.
Compare: suspected source areas with background sites, at suitable depths. Soil is heterogeneous, and total concentration may not equal the mobile or bioavailable fraction.
Chemicals cross boundaries. Dry particles settle onto soil and water; rainfall carries deposited material into waterways; dissolved substances leach into groundwater; metals may bind to sediment and later become mobile again. Sampling only one compartment may miss a source, a pathway or a reservoir.
Choose the right Australian guideline family
Naming the correct framework — and knowing what kind of document it is — can strengthen a high-mark answer. You are not expected to memorise any numbers.
Framework
What it is for
ANZG
Australian and New Zealand Guidelines for Fresh and Marine Water Quality — environmental water quality.
Ambient Air Quality NEPM
National ambient-air standards and monitoring.
ASC NEPM
Assessment of Site Contamination — contaminated land.
Australian Drinking Water Guidelines (ADWG)
Water intended for drinking. Not an automatic ecosystem benchmark.
These frameworks have different purposes, and they are not all the same kind of document.NEPMs are legally binding national instruments, which states and territories implement through their own arrangements. ANZG and the ADWG are guideline frameworks.
In every case a published number is not automatically a site-specific legal limit: do not substitute a drinking-water value for an ecosystem value, and use the framework relevant to the medium, the purpose and the jurisdiction.
5 · Eutrophication: nutrients, biomass and oxygen demand
Nutrient enrichment can stimulate excessive primary production; decomposition of the resulting organic matter can increase oxygen demand and reduce dissolved oxygen.
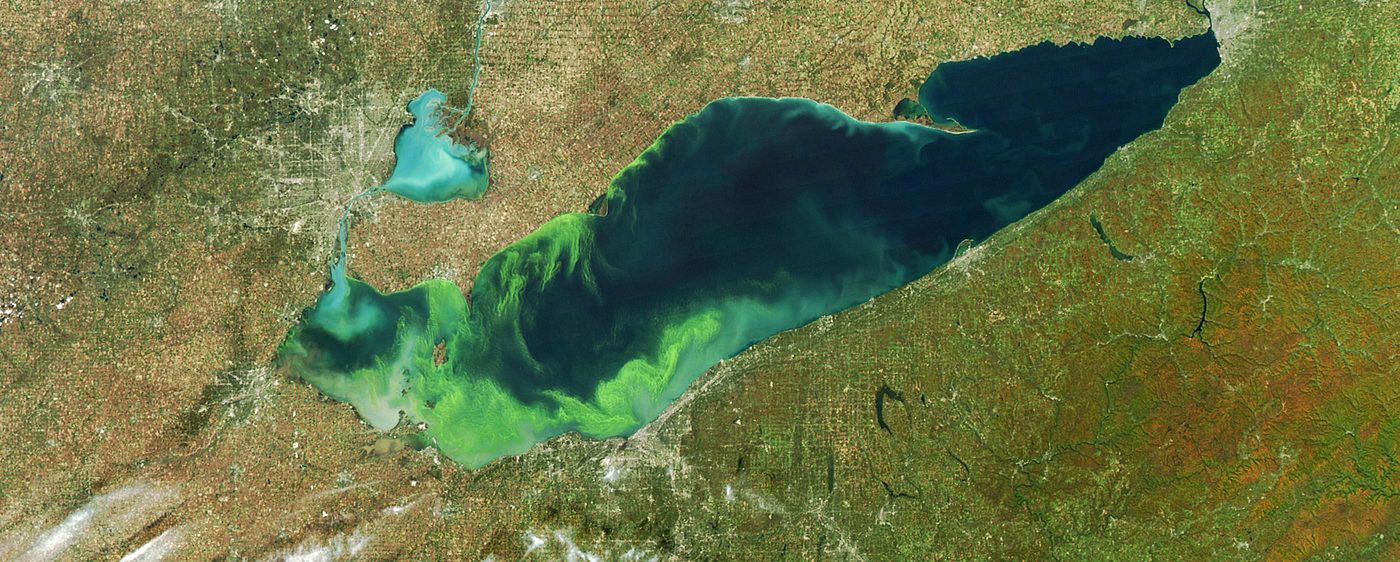
Algal bloom, Lake Erie. The visible green surface is an observation. Nutrient input and oxygen depletion are testable explanations — so measure nitrate or phosphate, chlorophyll-a and dissolved oxygen across sites and time before claiming either.
NASA Earth Observatory image via USGS, public domain. Source · Public-domain notice
Trigger. Fertiliser runoff, animal waste, sewage or nutrient-rich discharge. Pressure indicators: nitrate and phosphate. Response indicators: chlorophyll-a or algal biomass, turbidity and dissolved oxygen. Temperature, flow, light and season help interpret the pattern.
Photosynthesis converts carbon dioxide and water into glucose and oxygen using light. Extra available nutrients may remove a growth limitation and promote biomass — but a bloom is not inevitable: light, temperature, residence time, grazing and other nutrients also affect growth.
Algae, plants and other organic matter eventually die. Aerobic microorganisms decompose the material and respire, consuming dissolved oxygen. Increased biochemical oxygen demand can lower dissolved oxygen, especially at night or in poorly mixed water, stressing or killing oxygen-dependent organisms.
Weak: “Algae use all the oxygen.”
Accurate: The biomass dies; aerobic microorganisms then decompose it and respire, raising biochemical oxygen demand so dissolved oxygen falls.
Swipe the diagram sideways →
The exam-safe mechanism has two stages: growth, then death and decomposition. Answers that stop at “algae grow” lose the oxygen-demand mark.
The exam chain, in order
Nutrient inputNitrate and phosphate enter from runoff or wastewater.
Producer growthAlgae or aquatic plants form more biomass when nutrients were the limiting factor.
Light is reducedDense surface growth can shade submerged producers.
Biomass diesDead organic matter becomes substrate for decomposers.
Hypoxia risk risesLow dissolved oxygen stresses or kills aquatic organisms.
Why monitor nutrients and dissolved oxygen together? They describe different parts of the mechanism. A nutrient increase is evidence of pressure; an oxygen decline is evidence of ecological response. Chlorophyll-a or turbidity supports the connection but cannot replace either measurement.
Design. Sample upstream and downstream of likely inputs, at several sites and depths, across runoff events and seasons, and at comparable times of day. Dissolved oxygen naturally changes with temperature, mixing, photosynthesis and respiration, so one midday reading cannot describe the full risk.
Evaluating management. If nutrients decline after improved fertiliser management or wastewater treatment, and oxygen conditions improve across repeated comparable measurements, the evidence supports effectiveness. Weather, flow and delayed nutrient release from sediment still limit causal claims.
6 · Acid deposition: establish the right baseline
Acid deposition involves acidic substances formed from sulfur and nitrogen oxide emissions and transferred to surfaces by wet or dry pathways.
A highly reusable point for acid-deposition questions
Unpolluted rain is naturally mildly acidic, often around pH 5.6, because atmospheric carbon dioxide dissolves and forms carbonic acid, which partially ionises.
Natural rain baseline
CO₂(g) + H₂O(l) ⇌ H₂CO₃(aq)
Dissolved atmospheric carbon dioxide forms carbonic acid.
Natural rain baseline
H₂CO₃(aq) ⇌ H⁺(aq) + HCO₃⁻(aq)
Partial ionisation produces hydrogen ions; carbonic acid is weak.
Therefore “rain below pH 7” does not identify acid deposition. You need a local baseline, repeated measurements, and precursor evidence.
Weathered sandstone, Dresden. Surface damage is consistent with accelerated weathering in polluted air, but a photograph alone cannot assign one cause. Rainwater pH, sulfur and nitrogen oxides, deposition rates and a suitable comparison are all needed.
Slick, CC0 1.0, via Wikimedia Commons and USGS. Source · CC0 1.0 licence
Where the acids come from
Combustion of sulfur-containing fuels and some industrial processes release sulfur dioxide. High-temperature combustion produces nitrogen oxides. These pollutants undergo multistep atmospheric reactions that form sulfuric and nitric acids.
Acid deposition
2SO₂(g) + O₂(g) → 2SO₃(g)
An overall representation of oxidation; real atmospheric pathways are multistep.
Acid deposition
SO₃(g) + H₂O(l) → H₂SO₄(aq)
Sulfur trioxide reacts with water to form sulfuric acid.
Acid deposition
4NO₂(g) + O₂(g) + 2H₂O(l) → 4HNO₃(aq)
Overall nitric acid formation from nitrogen dioxide; atmospheric chemistry is multistep.
Say this in your answer: “The equations shown are useful overall representations, not elementary mechanisms.” It costs one clause and shows genuine chemical understanding.
Swipe the diagram sideways →
Measure both the emission pressure and the receiving environment. Rainfall pH alone cannot identify an exact source — and it misses dry deposition entirely.
In cloud or precipitation
Wet deposition
Gas or particle→Dissolves or reacts in droplets→Rain, fog or snow reaches a surface
Collect precipitation by event or over a defined interval; measure pH and relevant ions. Record rainfall amount, because concentration and total deposited load answer different questions — a larger rain event may have lower concentration while depositing a substantial total amount.
Between precipitation events
Dry deposition
Gas or particle→Settles or contacts a surface→Accumulates or is later washed off
Measure ambient gases and particles, or use a validated deposition collector. Dry material can later be mobilised by rain, so it still contributes to soil, water and material exposure. Measuring rain alone misses this pathway.
Effects. Acidic inputs may lower pH in poorly buffered soils and waters, alter nutrient and metal mobility, stress organisms and weather carbonate stone. Effects depend on dose and buffering capacity, so precursor emissions and environmental response should be monitored together.
Design. A paired design measures sulfur dioxide and nitrogen oxides upwind and downwind, records wind and weather, and measures precipitation chemistry plus soil or water pH. Before-and-after data can test controls, but long-range transport and meteorology limit simple source claims.
Wrong: “Carbon monoxide is the main cause of acid rain.”
Right: Sulfur oxides and nitrogen oxides are the principal precursors. CO is not a principal acid-deposition precursor.
Wrong: “Acid deposition and ocean acidification are the same process.”
Right: They are distinct. Ocean acidification is mainly driven by increased uptake of atmospheric carbon dioxide.
7 · Metal contamination: concentration, form and compartment
Mining, smelting, industry and legacy waste can introduce metals into water, soil and sediment. Risk depends on the named element, concentration, chemical form and exposure.
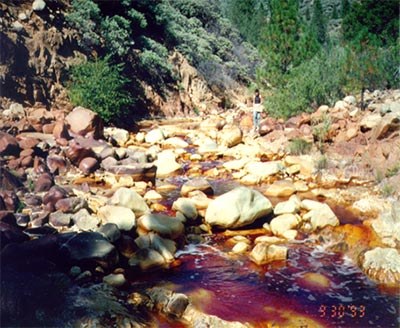
Acid mine drainage, Iron Mountain. Colour can indicate iron-rich precipitates, but named metal contamination requires measurements — pH and calibrated AAS results for dissolved metals, with blanks and upstream controls.
USGS, public domain. Source · Public-domain notice
Name the metal. Lead-containing mine waste may enter drainage water and accumulate in sediment; cadmium, copper, arsenic or mercury may be relevant elsewhere. Writing “heavy metals” alone is too vague for developed chemical analysis.
State how the sample was prepared. “Metal in water” is not one measurement. A filtered sample operationally estimates the dissolved fraction; an unfiltered sample may include suspended particulate metal, and depending on preservation and preparation the reported fraction may be operationally defined as total or recoverable metal. The meaning and comparability of a result are limited until you say which one it is.
Metals do not degrade like many organic compounds, but they move between compartments — dissolved, particulate, sediment, soil and biological. Total concentration may differ from the dissolved or bioavailable fraction, so water-only sampling may miss contamination stored in sediment or soil.
Chemical form matters. A metal may occur as a hydrated ion, a complex, a precipitated solid, or material adsorbed to mineral and organic surfaces. Changes in pH, redox conditions and ligands alter mobility and how available it is to organisms.
Qualified example
M(OH)₂(s) ⇌ M²⁺(aq) + 2OH⁻(aq)
For a hydroxide that follows this behaviour, decreasing pH removes hydroxide ions and can favour dissolution, increasing dissolved metal. Real samples also involve adsorption, competing ligands, minerals and oxidation states — so treat this as an illustration, not a universal rule.
Swipe the diagram sideways →
Water, sediment and organisms are not interchangeable samples. Each reveals a different exposure or storage pathway, so a program that samples only one may miss the reservoir entirely. The water fractions are operationally defined: a filtered result reports dissolved metal, while an unfiltered result is reported as total or recoverable depending on how the sample was preserved and prepared — always state which one you mean.
Bioaccumulation
Build-up of a substance within one organism over time, when uptake exceeds elimination.
Biomagnification
Increase in concentration at higher trophic levels — that is, at each step up the food chain.
Overclaim: “All heavy metals are toxic at any concentration and biomagnify.”
Defensible: Risk depends on the named substance, chemical form, concentration or dose, exposure route and duration. Methylmercury is a well-established biomagnification case; lead risk should be discussed through actual concentration and exposure.
Design. Sample water and sediment or soil, include background or upstream sites, repeat under different flow or weather conditions, and record pH. After contaminated material is removed, capped or isolated, repeat the same representative measurements to evaluate the remediation.
8 · Monitoring success: ozone, CFCs and the Montréal Protocol
Long-term monitoring can reveal a global problem, support coordinated action, and then test whether recovery follows. This is the clearest worked example of step 7 of the monitoring cycle.
Always specify which ozone you mean. Stratospheric ozone protects life by absorbing harmful ultraviolet radiation. Ground-level ozone is an air pollutant formed in photochemical smog. They are not the same thing and confusing them costs marks.
Measurements of stratospheric ozone and ozone-depleting substances, combined with atmospheric chemistry, linked chlorofluorocarbons and halons to ozone depletion. The Montréal Protocol then coordinated controls on these substances.
Monitoring did not itself repair the ozone layer. It established the problem, tested the explanation, supported decisions, and continues to track emissions, atmospheric concentrations and ozone recovery. Long atmospheric lifetimes mean recovery is gradual.
This is the full evidence cycle — monitor → analyse → act → re-monitor. It shows why a time series with multiple indicators is stronger evidence than one dramatic observation.
Wrong: “The ozone layer has been fully restored.”
Right: Continued monitoring tests whether controlled substances declined and whether ozone shows signs consistent with recovery, while also detecting unexpected emissions and replacement-chemical risks.
9 · Why Module 8’s analytical methods come next
A monitoring plan is useful only if the method can identify or quantify the required analyte, in the relevant concentration range, in the real sample matrix. This is the bridge from this dot point into the rest of the module.
Monitoring need
Method
Why it fits
Trace Pb, Cd, Cu or another selected metal
AAS
Element-selective quantification at low concentration after preparation and calibration.
Coloured species, or an analyte converted to a coloured complex
Colourimetry or UV–Vis
Use standards and a calibration curve to determine an unknown concentration.
Acidity of water, rain or a soil extract
Calibrated pH probe
Direct measurement, with calibration and temperature considered.
Oxygen stress in water
DO probe or validated wet chemistry
Quantifies the response; time, depth and temperature affect interpretation.
Selected ions at suitable concentration
Gravimetric analysis or precipitation titrations
These are the Module 8 quantitative methods you meet next. Suitable only when reaction chemistry, selectivity and concentration permit.
Possible identity of an ion
Qualitative ion test
May indicate presence, but environmental significance requires quantitative data.
Method choice is a judgement, not a habit
Method choice depends on analyte, concentration, matrix, selectivity, detection limit, accuracy, precision, cost and the decision being made. A precipitation method may be unsuitable for trace lead if its detection limit is too high; AAS may provide the required sensitivity.
Calibration
Relates instrument response to known standards. Without it a reading is a number, not a concentration.
Blank
Follows the reagents and procedure without the analyte, revealing background or contamination.
Replicates & check standards
Replicates assess precision; check standards or certified reference materials test accuracy.
Detection limit
The lowest concentration reliably distinguished from method background. “Below detection limit” ≠ absent — it means not detected by that method at that limit.
ppm and ppb. For dilute aqueous solutions near 1.00 kg L⁻¹, 1 mg L⁻¹ ≈ 1 ppm and 1 μg L⁻¹ ≈ 1 ppb. Use the units and density supplied in the question rather than treating this as universally exact.
Matrix effects occur when other sample components alter measurement response or recovery. Real water, soil and air samples are not pure solutions; preparation, matrix matching or standard addition may be needed in later method-specific work.
Swipe the graph sideways →
Four standards define the response–concentration line; the unknown is read onto that line, never past it. Q6 in section 13 uses exactly this relationship (slope 0.040, in μg L⁻¹ for trace lead), including the five-fold dilution correction. If a sample reads above the top standard, dilute it and measure again — do not assume the line continues.
Exam-safe sentence you can reuse: “AAS is suitable for trace lead because it can quantify a selected metal at very low concentration. Calibration standards establish the response–concentration relationship, and a procedural blank checks for background signal or contamination. The result should then be interpreted against an appropriate baseline or guideline, not in isolation.”
10 · Turn a result into defensible evidence
A high-quality conclusion keeps four things separate: observation, inference, limitation and decision.
ObservationReport the pattern with units, locations and time. “Site C nitrate was 4.8 mg L⁻¹ compared with 0.7 mg L⁻¹ upstream” is far stronger than “nitrate was high”.
InferenceExplain what the pattern suggests, with qualified language. A nitrate source between the sites may be contributing; the farm has not automatically been proven responsible.
LimitationIdentify the evidence gap. One day cannot establish persistence; one indicator cannot identify an exact source; a result near the detection limit carries uncertainty; changing rainfall or flow may explain part of the difference.
DecisionRepeat comparable sampling, add sites beside likely inputs, measure a paired response indicator, apply an appropriate guideline, investigate the suspected source, or evaluate management.
Scientific caution is not weakness. It lets you make the strongest claim the evidence actually supports, without overclaiming.
Worked dataset A — one sampling day near a discharge
A spatial pattern is evidence, not automatic proof. Fictional teaching data from one sampling day. The bars give a quick comparison; the table carries the exact values.
Upstream nitrate0.4
Outfall nitrate4.8
2 km downstream nitrate1.9
Upstream dissolved O₂8.6
Outfall dissolved O₂5.2
2 km downstream dissolved O₂6.7
Fictional nitrate and dissolved oxygen results at an upstream control, at an outfall and 2 km downstream
Site
Nitrate / mg L⁻¹
Dissolved O₂ / mg L⁻¹
Upstream control
0.4
8.6
At outfall
4.8
5.2
2 km downstream
1.9
6.7
Defensible interpretation: nitrate is higher and dissolved oxygen lower at the outfall than upstream on this occasion, which supports further investigation of the discharge. Repeat sampling across flow and weather conditions, use replicate samples and quality controls, and avoid claiming causation from one day.
Worked dataset B — the same logic as a graph
Swipe the graph sideways →
The inverse pattern is consistent with nutrient enrichment driving decomposition-based oxygen demand. It is not proof of a single source. Question 5 in the next section marks this exact dataset.
11 · The verb picks the structure. The marks pick the depth.
This is the single most useful sentence on the page. Read the command verb and the stimulus to decide which jobs your answer must do. Then use the mark value to decide only how far to develop them.
Step 1 — the verb decides the structure
Verb
What it demands
Structure it forces
Outline
Give the main features
Distinct points. Develop a mechanism only if the stem asks for its features.
Explain
Show how or why
A causal chain. No judgement required.
Analyse
Identify components and their relationships
Linked relationships, and their significance made explicit. An opening position can aid clarity but is not a required extra mark.
Distinguish
Make categories clearly different
One clear statement per named category — then complete any additional clause the stem adds (Q4 also asks for a limitation).
Determine / Calculate
Work out a value
Shown steps and units. Prose only where the stem asks.
Justify
Give reasons and evidence
A position, then support for it.
Assess / Evaluate
Make and support a judgement
A judgement is compulsory, with criteria. These are the two verbs that define the task as judging; justify needs a supported position, and discuss needs whatever conclusion its wording specifies.
Discuss
Identify issues and provide points for and/or against
More than one side. Include a conclusion or position when the wording and context call for one — it is not automatic.
Step 2 — the marks decide the depth
Once the verb has told you the shape, the mark value tells you how much to develop it. This is a depth scale, not a list of extra ingredients to add. The rows below describe typical depth for broad monitoring need-and-design responses — a calculation, distinguish or data-reading question follows its own stem instead.
Marks
How far to develop what the verb already demanded
≈ 2
Two distinct linked points. One sentence each.
3–4
Name the context and develop at least one causal or evidential link properly.
5–6
Develop the chain, and — where the stem calls for them — describe the comparison that produces the evidence and qualify at least one claim.
7–8
Sustain it, typically with representative and quality-controlled design, justified breadth, limitations and re-monitoring as the stem requires.
Two traps this ordering prevents. A 6-mark explain does not automatically need a judgement — the verb never asked for one. An 8-mark question does not automatically need two contexts compared — only if the stem says so. Adding either one unrequested is not required by the stem and is unlikely to be the best use of limited time.
A reliable way to develop analytical marks: a connected nutrient-to-oxygen chain with a defensible monitoring design has more analytical value than naming ten pollutants without relationships.
A reusable fluent scaffold
“Environmental monitoring is necessary because [trigger] may alter [condition]. Measuring [indicators] at [locations/times] and comparing results with [baseline or guideline] allows [change] to be detected. This matters because [mechanism and consequence]. Evidence can support [decision] and determine whether [action] is effective. However, [limitation], so [improved monitoring] is required.”
Filled in: “Agricultural runoff may alter nutrient and oxygen conditions. Measuring nitrate, phosphate and dissolved oxygen upstream and downstream over time detects enrichment and oxygen decline. Decomposition of excess biomass increases oxygen demand and may harm aquatic organisms. Evidence supports nutrient controls and tests improvement. One comparison cannot prove the exact source, so repeated representative sampling is required.”
Plan with this structure, then adapt it to the stimulus — do not memorise it unchanged.
12 · Common mistakes and precise repairs
These are common ways to lose precision. Replace vague or absolute claims with measurable chemistry and evidence.
“The environment is important.”
Name the change, the consequence and the use of the evidence.
“Monitoring cleans up pollution.”
Monitoring informs prevention or remediation. It does not remove anything.
“One sample proves a trend.”
Repeat comparable measurements before claiming a trend.
“Correlation proves the source.”
Distinguish observation, qualified inference and alternative explanations.
“Algae use all the oxygen.”
Explain death, microbial decomposition, respiration and oxygen demand.
“All heavy metals are toxic and biomagnify.”
Name the metal; qualify by concentration, form and exposure. Distinguish bioaccumulation from biomagnification.
“Any rain below pH 7 is acid rain.”
Use the natural carbonic-acid baseline (≈ pH 5.6) plus paired precursor and deposition evidence.
“Below detection limit means absent.”
State the method and its detection limit. Not detected ≠ not present.
“The guideline was exceeded, so the source is proven.”
Check the guideline’s purpose, sampling quality, uncertainty, persistence and alternatives.
13 · Worked questions
Ten questions from a 2-mark purpose question to an unfamiliar 8-mark monitoring design. Every model is available immediately — writing first is strongly recommended, but never forced.
Each question ends with a second one. After the mark map you will find Now try this one — the same
chemistry and the same TRACE structure, moved into a context you have not seen. That is the skill the HSC actually tests
in this dot point, because the exam puts unfamiliar substances and ecosystems in front of you. Write it on paper, then
open the guidance to check what a good answer had to contain.
Unless a value is explicitly identified as a published one, every number in these questions is an educational value. Calibration slopes and investigation values are chosen so the arithmetic stays clean. One exception, named honestly: the nitrate transfer question uses the published ADWG nitrate guideline of 50 mg L⁻¹ (as NO₃⁻), supplied to you in that stem. In an exam, always use the value the question gives you — never one memorised from here.
How to read the mark maps. This is one transparent SKY practice allocation. Official mark allocation depends on the exact question and marking criteria; equivalent valid chemistry may also earn credit. These are not reproduced NESA marking guidelines.
2 marksOutlineWhy monitor?
Outline why environmental monitoring is necessary.
CommandOutline = give the essential features without a long mechanism.
FocusState what monitoring detects, then what the evidence enables.
TargetTwo linked, distinct ideas in about 35–50 purposeful words.
TRACE plan
RRepeated measurements detect changes from normal conditions.
EEvidence supports protection and management.
Fluent model answer
Environmental monitoring detects changes in pollutant concentrations or environmental conditions that may threaten ecosystems or human health. The evidence then supports timely management and protective action.
This is what you write in the booklet — continuous prose, no labels or letters.
Mark map — 2 marks
Mark for
Phrase in the model
Why it earns the mark
Detects or characterises a potentially harmful environmental change.
“detects changes in pollutant concentrations or environmental conditions”
Names the evidence-producing purpose of monitoring.
Connects the evidence to a justified use.
“supports timely management and protective action”
Explains why detecting the change matters.
Also creditworthy · where marks are lost
Also creditworthy
Establishes a baseline from which later change can be judged.
Checks whether pollution controls or remediation are effective.
Where marks are lost
Saying only that monitoring “helps the environment”.
Repeating “detects pollution” without stating how the evidence is used.
Now try this one2 marks · Outline Outline why monitoring should continue after a pollution-control measure is introduced.
What a good answer must contain
The control is only a claim until it is tested — repeated, comparable measurements show whether concentrations actually fell.
Monitoring also shows whether the improvement persists, and can detect a new or shifted problem.
Two linked ideas is enough at this length. Do not drift into a full eutrophication mechanism.
Write it on paper first. There is no full model here on purpose — if you can produce these points yourself, you have transferred the method rather than memorised the example.
3 marksExplainNatural rain and acid deposition
Explain why rain with pH 5.6 is not, by itself, evidence of acid deposition.
CommandExplain = give the chemical cause and connect it to the conclusion.
FocusUse the carbon dioxide equilibria, then state what comparison is needed.
TargetA short causal chain — not just “rain is naturally acidic”.
TRACE plan
TAtmospheric CO₂ dissolves in rain.
ACarbonic acid partially ionises.
R/ECompare repeated pH and deposition chemistry with a local baseline.
Fluent model answer
Atmospheric carbon dioxide dissolves in rainwater and forms carbonic acid, which partially ionises to produce hydrogen ions. Unpolluted rain is therefore naturally mildly acidic, commonly near pH 5.6. Evidence for acid deposition requires repeated measurements below an appropriate local baseline together with relevant sulfur- or nitrogen-containing deposition data.
This is what you write in the booklet — continuous prose, no labels or letters.
Mark map — 3 marks
Mark for
Phrase in the model
Why it earns the mark
Identifies natural carbonic-acid formation.
“carbon dioxide dissolves in rainwater and forms carbonic acid”
Provides the chemical origin of natural rainwater acidity.
Links ionisation to the natural pH baseline.
“partially ionises to produce hydrogen ions”
Explains, rather than merely states, that rain is mildly acidic.
States the evidence needed before attributing acid deposition.
“repeated measurements below an appropriate local baseline together with relevant sulfur- or nitrogen-containing deposition data”
Avoids treating one pH value as proof of a pollution source.
Comparing with an upwind or long-term reference record where appropriate.
Where marks are lost
Calling all rain below pH 7 “acid rain”.
Claiming pH alone identifies SO₂ as the source.
Now try this one3 marks · Explain A rain sample has pH 4.4. Explain why further monitoring is still required before naming a source.
What a good answer must contain
Start by accepting the signal: 4.4 is well below the conventional carbonic-acid benchmark near pH 5.6, so it warrants investigation. Natural rainwater does vary locally, so compare against a local baseline rather than declaring it abnormal outright.
But one sample cannot establish a trend, and pH alone does not identify a precursor or a source.
Name what would: repeated precipitation chemistry (sulfate and nitrate, not just pH), SO₂ and NOₓ upwind and downwind, wind and weather records, and a local baseline.
Finish with the decision — repeat and compare before attributing a source.
Write it on paper first. There is no full model here on purpose — if you can produce these points yourself, you have transferred the method rather than memorised the example.
4 marksAnalyseLead downstream from a former mine
Analyse why lead concentrations should be monitored in both water and sediment downstream from a former mining site.
CommandAnalyse = show linked relationships and their significance.
FocusConnect source, two media, exposure/risk and a monitoring decision.
TargetA qualified TRACE chain. Do not claim all lead is equally available.
TRACE plan
TLead-bearing mine waste.
RUpstream/downstream water and sediment concentrations.
A/CTransport, storage and continuing exposure.
EAssess risk and evaluate remediation.
Fluent model answer
Lead-bearing waste from a former mine may enter surface water, while particles can settle and remain in sediment as a longer-term contamination reservoir. Water measurements characterise lead present in the water column at the time of sampling, but their interpretation depends on whether filtered dissolved lead or an appropriately prepared unfiltered fraction was measured. Sediment can retain particle-bound lead and act as a longer-term reservoir that may later be resuspended or expose bottom-dwelling (benthic) organisms. Because toxicity depends on concentration, chemical form and exposure, repeated upstream and downstream results are needed to assess risk and determine whether remediation is effective.
This is what you write in the booklet — continuous prose, no labels or letters.
Mark map — 4 marks
Mark for
Phrase in the model
Why it earns the mark
Connects a plausible source to receiving water.
“Lead-bearing waste from a former mine may enter surface water”
Establishes the source–pathway context without claiming it is proven.
Explains that interpretation depends on the measured fraction.
“depends on whether filtered dissolved lead or an appropriately prepared unfiltered fraction was measured”
The interpretation and comparability of a water result are limited until the measured fraction is stated.
Explains sediment storage and the exposure it creates.
“Sediment can retain particle-bound lead and act as a longer-term reservoir that may later be resuspended or expose bottom-dwelling (benthic) organisms”
One idea: sediment holds what water sampling can miss, and that store is itself the exposure pathway.
Explains how comparative repeated evidence supports action.
“repeated upstream and downstream results are needed to assess risk and determine whether remediation is effective”
Completes the analysis with an evidence-to-action decision.
Also creditworthy · where marks are lost
Also creditworthy
AAS may be suitable for measuring trace lead after appropriate sample preparation and calibration.
Sediment cores may reveal historical deposition where that design is justified.
Where marks are lost
Writing that every heavy metal is lethal at any concentration.
Listing water and sediment without explaining why each is measured.
Now try this one4 marks · Analyse Analyse why mercury in water, sediment and organisms can require different monitoring evidence.
What a good answer must contain
Water shows what is in the water column at the time of sampling. A filtered sample operationally estimates the dissolved fraction; an unfiltered one may also include suspended particulate metal, and depending on preservation and preparation the reported fraction may be operationally defined as total or recoverable. Always state the sampling and preparation method.
Sediment is a long-term reservoir that can be resuspended, so it records contamination water sampling would miss.
Organisms show actual uptake. Mercury (as methylmercury) is the established biomagnification case, so tissue data across trophic levels tests exposure that water alone cannot.
Add that pH and redox conditions affect chemical form, and close with what the combined evidence lets managers decide.
Write it on paper first. There is no full model here on purpose — if you can produce these points yourself, you have transferred the method rather than memorised the example.
4 marksDistinguishObservation, inference and decision
Monitoring shows higher mercury concentrations in sediment downstream from an industrial area than upstream. Distinguish an observation, an inference and a justified management decision, and state one limitation of the inference.
CommandDistinguish = make the categories clearly different.
FocusKeep measured fact, possible explanation and next action separate.
TargetCautious evidence language; the comparison does not identify a source by itself.
TRACE plan
RState the measured spatial pattern.
AInfer a possible source, but qualify it.
EInvestigate and manage proportionately.
Fluent model answer
The observation is that mercury concentration is higher in downstream sediment than at the upstream comparison site. A reasonable inference is that a source within or near the industrial area may be contributing mercury, although the data do not identify the exact source. Authorities should repeat water and sediment sampling at additional locations, investigate likely discharge points and apply exposure controls if the measured concentrations indicate unacceptable risk.
This is what you write in the booklet — continuous prose, no labels or letters.
Mark map — 4 marks
Mark for
Phrase in the model
Why it earns the mark
States only the measured observation.
“mercury concentration is higher in downstream sediment than at the upstream comparison site”
Accurately reports the data without inserting causation.
Gives a plausible inference.
“a source within or near the industrial area may be contributing mercury”
Interprets the spatial pattern using qualified language.
States the limitation of the inference.
“the data do not identify the exact source”
Separates an inference from a proven cause.
Proposes a proportionate evidence-based decision.
“repeat water and sediment sampling at additional locations, investigate likely discharge points”
The action directly addresses the unresolved source and extent.
Also creditworthy · where marks are lost
Also creditworthy
Sample between individual discharge points to improve spatial resolution.
Include blanks, replicates and suitable reference material in the analytical program.
Where marks are lost
Calling “the factory polluted the river” an observation.
Demanding remediation without first considering whether concentrations represent unacceptable risk.
Now try this one4 marks · Distinguish Separate observation, inference and decision for elevated copper measured after rainfall.
What a good answer must contain
Observation: state the measured copper concentration, the site and the timing, compared with the reference site. No cause.
Inference: rainfall may have mobilised copper from a source in the catchment — use “may”.
Limitation: rainfall changes runoff and dilution, so this may be event-driven; one event cannot establish persistence and the source is not identified.
Decision: repeat in both wet and dry conditions at reference and suspected-source sites.
Write it on paper first. There is no full model here on purpose — if you can produce these points yourself, you have transferred the method rather than memorised the example.
5 marksAnalyseRead a nitrate–oxygen dataset
Calculate the upstream-to-downstream change in each variable. Then analyse what the results suggest, and explain why continued monitoring is required.
Fictional teaching data: nitrate and dissolved oxygen at three river sites
Site
Nitrate / mg L⁻¹
Dissolved oxygen / mg L⁻¹
Upstream
0.8
8.4
Beside farmland
3.7
6.9
Downstream
4.1
5.3
Fictional teaching data. The same figures are graphed in section 10.
CommandAnalyse = quantify the pattern, connect it to a mechanism, qualify the inference and state the evidence needed.
FocusCalculate both upstream-to-downstream changes, with units.
TargetObservation → inference → limitation → decision, used inside TRACE.
TRACE plan
RNitrate rises 3.3 mg L⁻¹ and DO falls 3.1 mg L⁻¹.
A/CNutrient enrichment may increase biomass and decomposition-driven oxygen demand.
EThe pattern is not proof; repeat across sites, times and flow conditions.
Fluent model answer
From upstream to downstream, nitrate increases by 3.3 mg L⁻¹, from 0.8 to 4.1 mg L⁻¹, while dissolved oxygen decreases by 3.1 mg L⁻¹, from 8.4 to 5.3 mg L⁻¹. This inverse pattern is consistent with nutrient enrichment contributing to increased biomass and decomposition-driven oxygen demand. It does not prove that farmland is the only source, because other inputs, flow conditions and natural variation have not been excluded. Repeated sampling at more sites, times and flow conditions is required to test the pattern, locate likely inputs and judge whether nutrient management is effective.
This is what you write in the booklet — continuous prose, no labels or letters.
Show the calculation
Δ nitrate = 4.1 − 0.8 = +3.3 mg L⁻¹
Δ dissolved oxygen = 5.3 − 8.4 = −3.1 mg L⁻¹
Mark map — 5 marks
Mark for
Phrase in the model
Why it earns the mark
Correctly calculates and reports the nitrate change.
“nitrate increases by 3.3 mg L⁻¹”
Uses the stimulus quantitatively with the correct unit.
Correctly calculates and reports the dissolved-oxygen change.
“dissolved oxygen decreases by 3.1 mg L⁻¹”
Identifies the second numerical trend separately.
Connects the pattern to a chemically sound mechanism.
“decomposition-driven oxygen demand”
Explains the relevant oxygen-consuming step rather than saying algae simply use all the oxygen.
Qualifies the causal inference.
“does not prove that farmland is the only source”
Recognises that correlation across three sites does not establish exclusive causation.
Specifies how continued evidence supports a decision.
“Repeated sampling at more sites, times and flow conditions”
Improves spatial and temporal representativeness and permits management evaluation.
Also creditworthy · where marks are lost
Also creditworthy
Measure phosphate, chlorophyll-a or algal biomass as additional justified indicators.
Include an additional catchment reference site plus rainfall and flow records.
Where marks are lost
Omitting values or units.
Claiming algae directly “use up all the oxygen” rather than explaining decomposition and respiration.
Stating that the farm is proven to be the only source.
Now try this one5 marks · Analyse A graph shows phosphate rising and dissolved oxygen falling after a storm. Calculate the changes, interpret the relationship and design a follow-up.
What a good answer must contain
Quote both changes with values, units and direction — read them off the graph, do not describe them vaguely.
Connect them: nutrient enrichment → biomass → death → microbial decomposition and respiration → oxygen demand ↑ → DO ↓.
Qualify hard: a storm also changes flow, turbidity, temperature and mixing, so the correlation is not proof.
Follow-up: repeat across storm and baseflow conditions at upstream/reference and downstream sites, add chlorophyll-a, and record rainfall, flow and temperature.
Write it on paper first. There is no full model here on purpose — if you can produce these points yourself, you have transferred the method rather than memorised the example.
5 marksDetermine & assessAAS calibration and monitoring decision
A fictional AAS calibration for lead is linear: absorbance = 0.040 × concentration (μg L⁻¹). The calibration was prepared from standards spanning 0–8.00 μg L⁻¹, and the stated slope is exact for this exercise. A diluted water sample has absorbance 0.120 and was prepared using a five-fold dilution. Confirm the diluted result lies within the calibrated range, determine the original concentration and the mass of lead in 1.00 L, then assess the result against a fictional investigation value of 12 μg L⁻¹.
CommandDetermine = calculate. Assess = make a supported judgement against the supplied value.
FocusRead the calibration relationship, reverse the dilution, keep units, compare and qualify.
TargetShow every numerical step, then state the judgement against the supplied value. Nothing further is asked for.
TRACE plan
RCalibration gives the diluted concentration.
AReverse the dilution and calculate mass.
C/ECompare the corrected concentration with the supplied investigation value and state the judgement. This stem stops there.
Fluent model answer
The diluted sample concentration is 0.120 ÷ 0.040 = 3.00 μg L⁻¹, which lies inside the 0–8.00 μg L⁻¹ calibrated range, so the linear relationship may be applied. Correcting for the five-fold dilution gives an original concentration of 15.0 μg L⁻¹, so 1.00 L contains 15.0 μg of lead. This exceeds the fictional investigation value of 12 μg L⁻¹ and therefore warrants investigation.
This is what you write in the booklet — continuous prose, with the working shown alongside.
Show the calculation
c(diluted) = A ÷ slope = 0.120 ÷ 0.040 = 3.00 μg L⁻¹ — inside the 0–8.00 μg L⁻¹ calibrated range, so the linear relationship may be used
c(original) = 3.00 × 5 = 15.0 μg L⁻¹
m = cV = 15.0 μg L⁻¹ × 1.00 L = 15.0 μg
Mark map — 5 marks
Mark for
Phrase in the model
Why it earns the mark
Confirms the diluted result lies within the calibrated range.
“inside the 0–8.00 μg L⁻¹ calibrated range, so the linear relationship may be applied”
Checks the linear model may legitimately be used before applying it.
Calculates the diluted concentration.
“0.120 ÷ 0.040 = 3.00 μg L⁻¹”
Correctly rearranges the supplied calibration relationship.
Corrects for the dilution.
“original concentration of 15.0 μg L⁻¹”
Applies the five-fold dilution factor to the measured solution.
Calculates mass in the specified volume.
“1.00 L contains 15.0 μg”
Uses mass = concentration × volume with consistent units.
Makes the required comparison and judgement.
“exceeds the fictional investigation value of 12 μg L⁻¹ and therefore warrants investigation”
Directly assesses the calculated result against the supplied comparison.
Also creditworthy · where marks are lost
Also creditworthy
Noting the scale — 15.0 μg L⁻¹ is about 15 ppb in dilute water. At that concentration a suitably sensitive instrumental method, such as an appropriate AAS configuration, is needed; direct precipitation or gravimetric analysis would generally be insufficient unless a preconcentration step were used. Connecting the number to the method choice shows real understanding.
Stating a limitation and follow-up — “one result does not establish the source or a trend; calibrated repeats, blanks, standards and spatial sampling are required.” Good practice and often credited elsewhere, but this stem does not ask for it, so do not spend time on it before the five requested steps are complete.
A matrix-matched calibration or standard addition may be justified if matrix effects are significant.
Replicate field samples address spatial variation; replicate instrument readings alone do not.
Where marks are lost
Forgetting the dilution factor.
Reporting 15.0 without units, or writing mg where the calibration is in μg L⁻¹.
Calling the supplied fictional value a universal legal limit.
Now try this one4 marks · Determine and assess A UV–Vis method for nitrate is linear over 0–5.00 mg L⁻¹ with absorbance = 0.085 × concentration (mg L⁻¹); the coefficient is exact for this exercise. A rural household draws water from a river and drinks it untreated. A sample was diluted ten-fold and gave an absorbance of 0.255. (a) Confirm the diluted result lies within the calibrated range. (b) Determine the nitrate concentration in the original sample. (c) Assess the result against the ADWG health guideline of 50 mg L⁻¹ (as NO₃⁻), supplied here for that comparison.
What a good answer must contain
(a) 0.255 ÷ 0.085 = 3.00 mg L⁻¹, which is inside 0–5.00 mg L⁻¹ — so the linear relationship may be used. Say so explicitly; that is the mark.
(b) Correct the ten-fold dilution: 3.00 × 10 = 30.0 mg L⁻¹. Keep the units.
(c) 30.0 mg L⁻¹ is below the supplied 50 mg L⁻¹ health guideline, so this sample does not exceed it. Say so as a judgement — and resist the reflex to write “exceeds”. Then qualify it: a single result does not establish a trend, and it is not a complete compliance assessment. A rising series approaching the value would still matter.
The drinking-water framework fits because the stem specifies water consumed untreated. An ecosystem trigger value is not wrong in general — it is simply the wrong benchmark for this human-health question, and would be the right one for a separate ecological-risk question.
Write it on paper first. There is no full model here on purpose — if you can produce these points yourself, you have transferred the method rather than memorised the example.
6 marksEvaluateEvaluate a weak sampling plan
A student proposes testing a river once, at one downstream location, immediately after rainfall, to determine whether a wastewater outlet is causing long-term pollution. Evaluate the plan.
CommandEvaluate = make a judgement using criteria and evidence.
FocusExplain why each weakness matters, then replace it with a defensible design.
TargetA linked evaluation, not a shopping list of extra measurements.
TRACE plan
!Judgement (required by evaluate, and not one of the five TRACE letters — state it early, or develop it clearly into your conclusion): the plan is inadequate for establishing long-term causation.
RMissing upstream/reference site and temporal replication.
ARainfall changes dilution, runoff and discharge.
ERelevant indicators, multiple sites, repeated and replicate sampling.
Fluent model answer
The plan is inadequate for determining long-term pollution. A single downstream location provides no upstream or reference baseline, so existing river conditions cannot be separated from a possible outlet effect. One sample immediately after rainfall may be unrepresentative because rainfall changes runoff, dilution, flow and discharge rates, and one time point cannot establish a trend. A stronger program would measure indicators matched to the wastewater at upstream, outlet-adjacent and downstream sites. Replicate samples should be collected across multiple dates and both wet and dry conditions using consistent methods. This design would reveal spatial and temporal patterns and provide more reliable evidence about whether the outlet contributes to persistent pollution.
This is what you write in the booklet — continuous prose, no labels or letters.
Mark map — 6 marks
Mark for
Phrase in the model
Why it earns the mark
Makes an explicit overall judgement.
“inadequate for determining long-term pollution”
Answers the evaluate command rather than merely describing the plan.
Explains the missing comparison.
“no upstream or reference baseline”
Shows why one downstream result cannot separate background conditions.
Explains temporal/rainfall representativeness.
“rainfall changes runoff, dilution, flow and discharge rates”
Connects timing to the validity of the inference.
Selects relevant measurements and locations.
“indicators matched to the wastewater at upstream, outlet-adjacent and downstream sites”
Improves both chemical relevance and spatial resolution.
Adds defensible repetition and quality.
“Replicate samples … across multiple dates and both wet and dry conditions”
Addresses random variation and seasonal or event effects.
Explains the improved conclusion.
“provide more reliable evidence about whether the outlet contributes to persistent pollution”
Links design improvements to the decision the program must support.
Also creditworthy · where marks are lost
Also creditworthy
Include discharge-rate and weather data as covariates.
Use a before–after / control–impact design if suitable pre-impact data are available.
Where marks are lost
Saying only “take more samples”.
Adding instruments without identifying analytes relevant to the wastewater.
Claiming an upstream site is always pristine rather than checking its suitability.
Now try this one6 marks · Evaluate Evaluate a one-day soil-monitoring plan around a tailings storage facility.
What a good answer must contain
Commit to the judgement — early, or built into your conclusion: inadequate.
Why: soil is heterogeneous, so one day and a few points cannot characterise it; there is no background or upgradient reference; no depth profile; no replicates.
Add the chemistry: total concentration is not the mobile or bioavailable fraction, and pH controls metal mobility.
Improve it: reference sites upwind/upgradient, a sampling grid at defined depths, replicates, recorded pH, repeated across seasons and weather. The applicable framework is the ASC NEPM.
Close by saying what the improved design would then support.
Write it on paper first. There is no full model here on purpose — if you can produce these points yourself, you have transferred the method rather than memorised the example.
6 marksAnalyseWhy monitoring must cross air, water and soil
Analyse the need for environmental monitoring, using acid deposition and named-metal contamination as examples.
CommandAnalyse = build two linked examples and explain why the combined evidence is needed.
FocusPair source/transport readings with environmental-effect readings.
TargetAccurate chemistry, explicit comparisons, and an evidence-to-action conclusion.
TRACE plan
T/RSO₂/NOₓ emissions plus wet and dry deposition and pH.
A/CAcid-forming chemistry and ecosystem or material effects.
Environmental monitoring is needed because pollutants move between air, water and soil, and a source measurement alone does not establish exposure or harm. For acid deposition, repeated sulfur dioxide and nitrogen oxide measurements can be paired with wet-deposition chemistry, dry-deposition estimates and rainfall or receiving-water pH. This evidence tests whether acid-forming emissions are associated with environmental change and whether emission controls work. Near a mine or industrial site, measuring a named metal in water, soil and sediment can reveal contamination in transport and in longer-term storage, provided the water result states whether it is a filtered dissolved fraction or an unfiltered fraction prepared and reported as total or recoverable, while pH and chemical form help interpret mobility and bioavailability. Comparisons with suitable baselines and guideline frameworks support proportionate risk decisions. Monitoring therefore links sources, chemical behaviour and consequences, then tests whether management actually reduces exposure.
This is what you write in the booklet — continuous prose, no labels or letters.
Mark map — 6 marks
Mark for
Phrase in the model
Why it earns the mark
States the cross-media monitoring need.
“pollutants move between air, water and soil”
Frames why one compartment or source reading is insufficient.
Names complementary acid-deposition measurements.
“sulfur dioxide and nitrogen oxide measurements … paired with wet-deposition chemistry, dry-deposition estimates and rainfall or receiving-water pH”
Covers both possible pressure and environmental response.
Explains the acid-deposition evidence use.
“tests whether acid-forming emissions are associated with environmental change and whether emission controls work”
Connects measurements to analysis and re-monitoring.
Explains complementary metal media.
“water, soil and sediment can reveal contamination in transport and in longer-term storage, provided the water result states whether it is a filtered dissolved fraction or an unfiltered fraction prepared and reported as total or recoverable”
Shows distinct transport and reservoir roles.
Adds chemically relevant interpretation.
“pH and chemical form help interpret mobility and bioavailability”
Avoids treating total concentration as the whole risk assessment.
Concludes with comparison and management.
“baselines and guideline frameworks support proportionate risk decisions”
Explains the decision-making need for monitoring.
Also creditworthy · where marks are lost
Also creditworthy
Monitor susceptible materials or biological indicators alongside deposition chemistry where justified.
Use AAS for suitable trace-metal determinations and colourimetry/UV–Vis for suitable nutrient analytes.
Where marks are lost
Calling CO the principal acid-deposition gas.
Treating ocean acidification and acid deposition as the same process.
Now try this one6 marks · Analyse Analyse an unfamiliar industrial emission using paired source, transport and receiving-environment evidence.
What a good answer must contain
Do not invent chemistry for the emission — use only what the stimulus gives you.
Source: stack or ambient concentration of the named substance.
Transport: wind direction and speed, a distance gradient, and whether it travels as gas or particles.
Receiving environment: deposition, plus a condition indicator (soil or water pH) and a response indicator.
Include a baseline at an upwind or reference site, qualify that correlation is not causation and that long-range transport complicates attribution, then connect to controls and re-monitoring.
Write it on paper first. There is no full model here on purpose — if you can produce these points yourself, you have transferred the method rather than memorised the example.
8 marksDiscussUnfamiliar compound in a coastal wetland
A new industrial process releases a soluble compound into a coastal wetland. Its long-term environmental behaviour is uncertain. Discuss how and why an environmental monitoring program should be established.
CommandDiscuss = identify the relevant issues and provide points for and/or against. This stem asks how and why a program should be established, so it needs connected evidence and implications, and a reasoned conclusion is appropriate here.
FocusDesign monitoring under uncertainty without inventing the compound’s toxicity.
TargetA sustained TRACE response covering baseline, indicators, space, time, quality, limitation and action.
TRACE plan
TUncertain soluble industrial release.
RAnalyte plus condition/effect indicators; reference and gradient sites; tides and seasons.
A/CA pattern may indicate transport or risk, but cannot prove toxicity.
A monitoring program is necessary because the compound’s concentration, movement and effects cannot be managed reliably from assumptions. Background concentrations and wetland conditions should first be established at unaffected reference locations where possible. The compound itself should be measured with justified condition or effect indicators, such as pH, salinity, dissolved oxygen or biological condition, at the discharge, along a distance gradient and at reference sites. Sampling should be repeated across tides, rainfall events, seasons and production conditions, because these factors may change transport and exposure. Calibration standards, blanks, replicates and consistent collection and preservation are needed to make results comparable. A concentration pattern accompanied by environmental change may indicate a developing risk, but it does not alone prove toxicity or mechanism, so toxicity testing or further field evidence may be required. The evidence can trigger proportionate controls, guide source investigation and evaluate recovery. Monitoring is therefore needed both to detect harmful change early and to improve decisions as knowledge of the compound develops.
This is what you write in the booklet — continuous prose, no labels or letters.
Mark map — 8 marks
Mark for
Phrase in the model
Why it earns the mark
Establishes why monitoring is needed under uncertainty.
“cannot be managed reliably from assumptions”
Provides a clear judgement tied to evidence.
Establishes a baseline/reference comparison.
“Background concentrations and wetland conditions should first be established at unaffected reference locations”
Creates a defensible comparison for later change.
Selects relevant chemical and effect readings.
“compound itself should be measured with justified condition or effect indicators”
Avoids measuring either the analyte or ecosystem condition in isolation.
Designs spatial coverage.
“at the discharge, along a distance gradient and at reference sites”
Can reveal dispersion and distinguish background conditions.
Designs temporal coverage.
“across tides, rainfall events, seasons and production conditions”
Addresses processes specific to a coastal wetland and an industrial release.
Includes analytical and sampling quality.
“Calibration standards, blanks, replicates and consistent collection and preservation”
Makes measurements comparable and helps detect contamination or imprecision.
Qualifies what the pattern can establish.
“does not alone prove toxicity or mechanism”
Prevents an unsupported causal or toxicological conclusion.
Connects evidence to adaptive management.
“trigger proportionate controls, guide source investigation and evaluate recovery”
Completes the TRACE chain with action and re-monitoring.
Also creditworthy · where marks are lost
Also creditworthy
Measure degradation products if they may persist or be more hazardous.
Use passive samplers or continuous sensors only if they suit the analyte and monitoring question.
Include sediment if partitioning becomes important, despite the compound initially being described as soluble.
Where marks are lost
Inventing a health effect or reaction not given in the stimulus.
Writing “sample regularly” without specifying sites or changing conditions.
Listing quality-control terms without saying why comparable data matter.
Now try this one8 marks · Discuss A new airborne fluorinated compound is detected near a manufacturing precinct. Adapt the monitoring design to air transport and deposition.
What a good answer must contain
Same TRACE skeleton as the wetland question — only the medium changes from water to air.
Readings: ambient air upwind and downwind along a distance gradient, with wind direction, speed and weather recorded every time.
Cover both deposition pathways: precipitation chemistry for wet, and deposition collectors or surface samples for dry.
Because deposition moves it between compartments, add soil and water sampling for accumulation.
Quality: calibration, blanks, replicates, consistent method, and a detection limit low enough for trace work.
Do not invent toxicity. Say the pattern may indicate risk but cannot prove it, note that persistence and degradation products are unknown, and finish with proportionate controls plus re-monitoring.
Write it on paper first. There is no full model here on purpose — if you can produce these points yourself, you have transferred the method rather than memorised the example.
4 marksExplainMonitoring, action and re-monitoring
Explain how stratospheric ozone monitoring illustrates the full evidence-to-action cycle.
CommandExplain = connect the evidence, the causal investigation, the action and the later evidence.
FocusA compact monitoring-success extension — not a required example in every answer.
TargetShow why monitoring continues after international action.
TRACE plan
RRepeated ozone and atmospheric-composition measurements.
A/CConnect depletion with ozone-depleting substances and risk.
EMontréal Protocol controls, then re-monitoring.
Fluent model answer
Repeated measurements identified substantial changes in stratospheric ozone and allowed scientists to track ozone-depleting substances and investigate their chemical role. The evidence supported international controls under the Montréal Protocol. Continued monitoring then tested whether controlled substances declined and whether the ozone layer showed signs consistent with recovery, while also detecting variability and new risks. The example shows that monitoring is needed to detect a problem, justify action and evaluate whether the response works.
This is what you write in the booklet — continuous prose, no labels or letters.
Mark map — 4 marks
Mark for
Phrase in the model
Why it earns the mark
Identifies detection through repeated evidence.
“Repeated measurements identified substantial changes in stratospheric ozone”
Shows the baseline and trend role of monitoring.
Connects monitoring to causal investigation.
“track ozone-depleting substances and investigate their chemical role”
Goes beyond simply observing a change.
Connects evidence to management.
“supported international controls under the Montréal Protocol”
Explains how monitoring can justify coordinated action.
Explains the need for re-monitoring.
“tested whether controlled substances declined and whether the ozone layer showed signs consistent with recovery”
Shows that action does not end the evidence cycle.
Also creditworthy · where marks are lost
Also creditworthy
Satellite, balloon and ground-based measurements provide complementary evidence.
Continued monitoring can detect unexpected emissions or replacement-chemical risks.
Where marks are lost
Claiming the ozone layer is fully restored.
Describing the treaty without explaining the monitoring evidence.
Now try this one4 marks · Explain Explain how monitoring before and after sulfur-emission controls can evaluate acid-deposition management.
What a good answer must contain
Before: establish a baseline of SO₂ and precipitation chemistry and pH.
After: the same measurements, at the same sites, by the same methods — comparability is the whole point.
Pair pressure (SO₂) with response (rainfall pH, sulfate deposition, soil or surface-water pH). A fall in both supports effectiveness.
Qualify: meteorology, long-range transport and buffering capacity mean recovery lags, and other sources may contribute.
Continued monitoring tests whether the improvement persists.
Write it on paper first. There is no full model here on purpose — if you can produce these points yourself, you have transferred the method rather than memorised the example.
14 · Chemistry check
These test mechanisms and monitoring design, not clue words. Every option has its own feedback explaining exactly why it is right or wrong — including the plausible ones.
0 of 8 mastered
Only correct answers count towards mastery. A wrong attempt shows you why, and you can try the question again after resetting.
1. A creek’s nitrate concentration is 3.0 mg L⁻¹ today. Which additional evidence is most useful for deciding whether this represents environmental change?
Phosphate and chlorophyll-a may help investigate nutrient effects, but they do not establish whether today’s nitrate differs from its own baseline.
Correct. Spatial and temporal reference data show whether 3.0 mg L⁻¹ differs from the creek’s normal nitrate variation.
An upstream value adds a useful spatial comparison, but one day cannot distinguish a persistent change from temporal variation.
Conductivity may indicate changes in total dissolved ions, but a nitrate-specific conclusion needs comparable nitrate evidence.
2. Which process most directly explains a later fall in dissolved oxygen after nutrient enrichment produces a large algal bloom?
Photosynthesis affects oxygen, but the characteristic later decline is most directly linked to oxygen demand as increased biomass dies and decomposes.
Living algae do respire, especially at night, but this option omits the major decomposition demand created by the enlarged biomass.
Correct. Decomposers respire while breaking down the increased organic biomass, raising biochemical oxygen demand.
Nitrification can consume oxygen and may contribute in some waters, but it does not best connect the stated algal bloom to the later oxygen decline.
3. Which monitoring pair best distinguishes a possible acid-deposition source from a receiving-environment response?
Correct. SO₂ measures a possible source pressure while rainfall chemistry and pH measure deposition in the receiving environment.
Wind data help interpret transport, but this pair contains no receiving-environment chemical response.
Rainfall pH and lake alkalinity characterise environmental response and buffering, but the pair does not measure the suspected emission source.
Both measurements characterise the source process; they do not show whether acidic material reaches or changes the receiving environment.
4. Why can pH be useful when interpreting a dissolved-metal monitoring result?
Acid mine drainage is one plausible context, but pH does not identify a source without spatial and compositional evidence.
Lower pH can change solubility and dissolved fractions, but total concentration also depends on source, transport and partitioning.
Food-chain accumulation requires measurements across organisms or trophic levels; pH instead helps interpret chemical form and mobility.
Correct. Chemical form and solubility can change with pH, affecting interpretation of a measured concentration.
5. After contaminated sediment is remediated, which design gives the strongest evidence about effectiveness?
Before-and-after data at the treated site are useful, but without comparison sites they cannot separate remediation effects from wider environmental change.
Correct. Consistent measurements through time at treated and suitable comparison sites test persistence while accounting for background variation.
Replicate analyses improve analytical precision, but one post-remediation visit cannot establish change through time or recovery persistence.
Removed mass documents implementation, but effectiveness also requires evidence that residual contamination and exposure in the environment declined.
6. A council must measure lead near 5 μg L⁻¹ in hundreds of water samples. Which method feature is essential before throughput is considered?
Throughput and precision matter, but performance at 50 μg L⁻¹ does not show that the method can measure reliably near 5 μg L⁻¹.
A broad linear range is useful, but it does not establish adequate low-level detection or control matrix effects in environmental water.
Correct. A rapid method is not fit for purpose unless it can selectively detect and quantify lead near the concentration of concern.
Recovery at a much higher concentration is useful quality evidence, but it does not demonstrate sensitivity and accuracy near 5 μg L⁻¹.
7. Which change best improves a plan intended to distinguish a wastewater outlet effect from natural river variation?
Correct. Spatial comparisons and repeated field samples across conditions address both background and temporal variation.
More downstream samples improve short-term spatial detail, but a single afternoon lacks reference and temporal evidence.
The paired sites are useful, but one rainfall event may not represent normal discharge, flow or seasonal conditions.
Laboratory replicates estimate analytical precision, but two field bottles do not characterise spatial and temporal environmental variation.
8. A new soluble compound is released into a tidal wetland. Which initial monitoring design is most defensible?
A distance gradient helps track transport, but one tidal stage cannot characterise temporal variability or environmental effects.
Condition and effect indicators are useful, but without measuring the compound they cannot establish its concentration or transport pattern.
Analyte measurements across tides improve exposure evidence, but condition indicators are needed to test whether concentration changes accompany environmental effects.
Correct. This design directly measures the analyte and justified responses while addressing spatial transport, tidal variation and longer-term change.
15 · Flashcards
Say the answer out loud before you tap. Ten cards covering the traps that actually cost marks in this dot point.
0 of 10 seen at least once
16 · Reference
All eight equations in one place
Each one exists to explain a causal step. The notation is selectable so you can copy it into your own notes.
Natural rain baseline
CO₂(g) + H₂O(l) ⇌ H₂CO₃(aq)
Dissolved atmospheric carbon dioxide forms carbonic acid, helping make normal rain mildly acidic.
Natural rain baseline
H₂CO₃(aq) ⇌ H⁺(aq) + HCO₃⁻(aq)
Partial ionisation produces hydrogen ions; carbonic acid is weak.
Acid deposition
2SO₂(g) + O₂(g) → 2SO₃(g)
An overall representation of oxidation; real atmospheric pathways are multistep.
Acid deposition
SO₃(g) + H₂O(l) → H₂SO₄(aq)
Sulfur trioxide reacts with water to form sulfuric acid.
Acid deposition
4NO₂(g) + O₂(g) + 2H₂O(l) → 4HNO₃(aq)
Overall nitric acid formation from nitrogen dioxide; atmospheric chemistry is multistep.
Eutrophication
6CO₂(g) + 6H₂O(l) → C₆H₁₂O₆(aq) + 6O₂(g) (light)
Primary producers form biomass; extra nutrients may increase growth when they were the limiting factor.
Eutrophication
C₆H₁₂O₆(aq) + 6O₂(g) → 6CO₂(g) + 6H₂O(l)
Aerobic decomposition and respiration consume dissolved oxygen — this is the step that lowers DO.
Qualified metal example
M(OH)₂(s) ⇌ M²⁺(aq) + 2OH⁻(aq)
For an applicable hydroxide, lower pH can favour dissolution; real samples also involve adsorption, complexation and redox chemistry.
Glossary — 20 terms
Environmental monitoring
Systematic and repeated collection and analysis of data used to characterise conditions and detect change.
Baseline
A normal or reference condition used for comparison.
Trend
A consistent pattern supported by repeated measurements.
Threshold or guideline
A comparison value that may trigger investigation or action; its purpose and authority depend on the framework.
Indicator
A measurable property providing evidence about an environmental pressure or response.
Representative sample
A sample whose times, locations, depths and characteristics support the intended conclusion.
Replicate
An additional equivalent sample or measurement used to assess variation and precision.
Confounding variable
A factor other than the proposed cause that may affect a reading or pattern.
Wet deposition
Transfer of dissolved acids and acid-forming ions in rain, snow, fog or cloud water.
Dry deposition
Direct transfer of pollutant gases and particles to surfaces between precipitation events.
Eutrophication
Nutrient enrichment that increases primary production and may cause oxygen depletion.
Dissolved oxygen
Molecular oxygen dissolved in water and available for aquatic respiration.
Biochemical oxygen demand
Oxygen required by microorganisms to decompose biodegradable organic matter under specified conditions.
Bioaccumulation
Build-up of a substance within an organism over time.
Biomagnification
Increase in concentration at higher trophic levels in a food web — that is, at each step up the food chain.
Calibration
Establishing the relationship between measurement response and known standards.
Blank
Reagents and procedure without analyte, used to identify background or contamination.
Detection limit
Lowest concentration reliably distinguished from method background under stated conditions.
Matrix effect
A response change caused by sample components other than the analyte.
ppm and ppb
Parts per million and parts per billion; in dilute water near 1.00 kg L⁻¹, mg L⁻¹ ≈ ppm and μg L⁻¹ ≈ ppb.
Photograph credits and licences are listed in assets/ATTRIBUTION.md in this package and beneath each image above.
17 · Rapid recall checklist
Answer each of these out loud, without looking, before you move to exam application. If you stall on one, the linked section is where to go.
Define systematic, repeated and comparative monitoring. Distinguish baseline, trend, threshold, observation and inference. Explain the value of upstream, upwind and background sites. → §3
Write the eutrophication chain and distinguish nutrient pressure from ecological response. Explain why dissolved oxygen varies naturally. → §5
Explain natural rain acidity, identify the acid precursors, and distinguish wet from dry deposition. Explain why rainfall pH alone is incomplete. → §6
Name a metal and a compartment; explain pH-dependent mobility; distinguish bioaccumulation from biomagnification. → §7
Match ANZG, Ambient Air Quality NEPM, ASC NEPM and ADWG to their purposes. Explain why a published value is not automatically a site-specific legal limit, and which of these are guidelines rather than legal instruments. → §4
Select AAS for trace metals, colourimetry or UV–Vis for suitable coloured species, and calibrated probes for pH or DO. Define calibration, blank, detection limit, ppm, ppb and matrix effect. → §9
State TRACE: Trigger, Readings, Analysis, Consequence, Evidence to action. → §2
Want feedback on how you structure Chemistry answers?
Write your answers to the ten questions above on paper, then bring them to a lesson — we mark structure, not just chemistry.